
Open House: October 2017
Welcome to our Open House series. Every month we open the doors on our data to share information about our community, investment performance and measures of liquidity in the Resale Market. The series is born of our commitment to data transparency, and we hope you find it useful.
If you would like to receive the monthly Open House update by email and are not already signed up, please click below to register:
Our Investors
| £69.6M | £52.5M | £17.1M | £2.2M | 10,765 |
( £4.4M) £4.4M) |
(£3.8M) |
(£592k) |
(£156k) |
(143) |
| Total Investment | New Listing Investment | Capital returned to investors 1 | Rental income returned to investors | Total investors |
The figures above are correct as of October 31st, 2017. Figures in green represent a net change in the displayed figures from the previous month.
The chart above highlights how investment through the platform has grown since its inception in January 2015. Hover over the chart to see how much has been cumulatively invested in each month, and adjust the drop-down menu to see growth over a given time-period.
Our Properties
| £95.0M | 601 | 94 | 3.39% | 4.35% |
| Assets Under Management | Units Funded 2 | Investment Opportunities 3 | Avg Dividend Yield* | Avg Capital Growth* |
The figures above are correct as of October 31st, 2017.
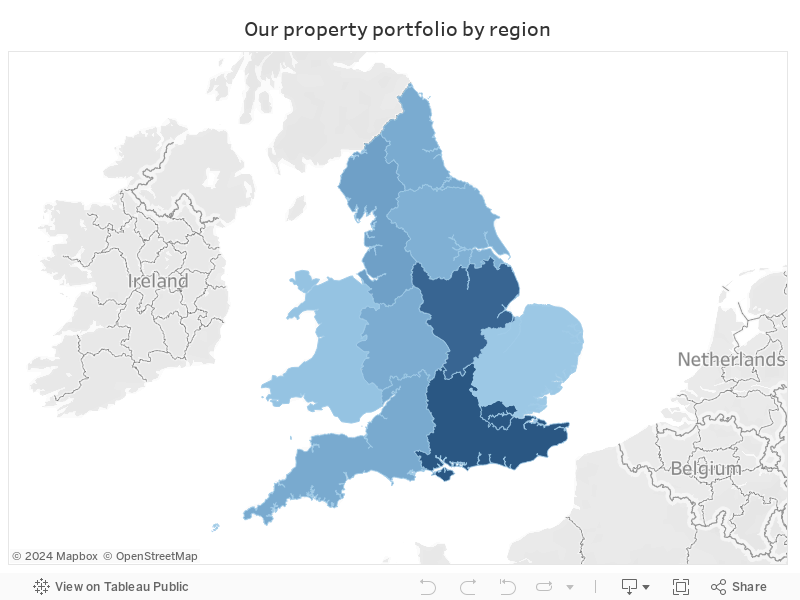
The chart above highlights our property portfolio by region. Hover over the chart to see the number of properties, the sum of property values and the average dividend yield in a specific region.
Rental Income and Property Valuations
To date, we have never underpaid a dividend. In some cases, we have managed to secure higher rent than originally forecast when the properties were listed on the platform.
All our properties are independently valued by a RICS qualified Chartered Surveyor at purchase, and at the end of each quarter thereafter (March, June, September & December). All revaluations go live on the platform on the 5th of the month following the quarter end. To learn more about the latest quarterly valuation and performance on platform, click here.
The surveyor’s valuation feeds into the Latest Share Valuation for each property, along with mortgage debt, amortised purchase costs and any deferred tax applicable to capital gains. You can download an Excel tracker of the historic share price movements below. The Excel tracker is updated monthly and will allow you to track the performance of each individual property.
The Resale Market
Investors can realise a capital return by selling shares on the Resale Market at any time, by placing an offer to sell at their chosen price or matching an existing bid order. Alternatively, investors can exit at market value five years after a property’s launch on platform. (Read more about 5-yearly mechanics here). Investors looking to purchase shares on the Resale Market can match a sell offer or place bids at their chosen price. Learn more about how the Resale Market works, here.
| £17.1M | £4.0M | 35% | 3.8 days |
| Capital returned to investors 1 | Matched by bids 4 | Portfolio traded on Resale Market 5 | Average time to sell 6 |
The figures above are correct as of October 31st, 2017.
We have also prepared a full download of Resale Market trading activity, including all transactions matched through bids. This spreadsheet allows you to review trading by property, including the trade date, trade price, premium to Initial Valuation, and premium to Latest Share Valuation.
We will continue to share information and data, to give investors a clear view on our performance. For those of you who are not yet investors, we hope that this data will help you make an informed decision as to whether to invest in properties through our platform.
And as always, you can view our latest investment opportunities by clicking below:
If you would like to provide any comments on this article, or offer your time for a call to provide general feedback, please call us on +44 (0)20 3696 5600 or drop us an email on hello@propertypartner.co
We’d love to speak with you.
1. ‘Capital returned to investors’ denotes the total value of shares sold on the Resale Market.
2. ‘Units Funded’ refers to the number of individual flats or houses that have been funded to date.
3. ‘Investment Opportunities’ refers to the total number of properties on the platform.
4. ‘Matched by bids’ refers to the total value of shares sold, resulting from bid orders being matched.
5. ‘Portfolio traded on Resale Market’ is the total value of shares sold on the Resale Market as a percentage of the total value of New Listing investment.
6. ‘Average time to sell’ denotes the weighted average time it has taken to sell shares at or below the 30-day weighted average share price.